One of the most crucial abilities any investor can acquire is an understanding of portfolio risk and return. The choices you make about risk will influence every dollar of gain—or loss—that you incur, regardless of how much money you have to start with or how much money you manage. This comprehensive guide explains the true meaning of portfolio risk, the practical application of the risk-return connection, and how astute investors apply these ideas to improve their daily financial choices.
Everything you need is covered in this essay, from defining portfolio risk to creating a workable balancing plan. Let’s begin.
Table of Contents
What Is Portfolio Risk?
Portfolio risk refers to the possibility that an investment portfolio will produce returns that are lower than expected, or result in financial loss. It measures the combined uncertainty of all assets held together — accounting for how those assets interact, not just their individual volatility.
Most investors think about risk one investment at a time. But portfolio risk is different — it looks at the big picture. When you hold multiple assets, their price movements can either cancel each other out or amplify each other. That interaction is what makes portfolio risk unique.
For example, if you hold both airline stocks and oil company stocks, a rise in fuel prices might hurt airlines but benefit oil producers. This natural hedge can reduce overall portfolio risk even if each individual stock carries its own uncertainty.
Key factors that affect portfolio risk include:
- The number and variety of assets in the portfolio
- How closely those assets move together (correlation)
- The volatility (price swings) of each individual asset
- Market conditions and macroeconomic trends
- The investor’s time horizon and liquidity needs
Managing portfolio risk wisely is not about eliminating uncertainty — that is impossible in investing. It is about understanding it, measuring it, and making choices that match your financial goals and tolerance for loss.
What Is Portfolio at Risk?
What is portfolio at risk? Portfolio at Risk (PAR) is a financial metric that measures the portion of a portfolio exposed to potential loss beyond a defined threshold — usually expressed as a percentage of total portfolio value that is considered impaired or at risk of default.
Originally used in microfinance to track loan portfolios, the concept of Portfolio at Risk has expanded into broader investment analysis. It tells fund managers and analysts what fraction of their holdings could underperform or lose value under specific conditions.
How Is Portfolio at Risk Calculated?
The basic formula is:
PAR (%) = (Value of At-Risk Assets / Total Portfolio Value) × 100
For example, suppose you manage a $200,000 investment portfolio. After analysis, you determine that $30,000 worth of holdings are exposed to significant downside risk — perhaps concentrated in a volatile sector or a single underperforming asset class.
PAR = ($30,000 / $200,000) × 100 = 15%
This means 15% of your portfolio is at risk. Here is a quick summary of what this metric tells you:
- PAR below 5%: Generally considered healthy and well-managed
- PAR between 5%–15%: Moderate concern; review asset allocation
- PAR above 15%: High exposure; rebalancing may be needed
Portfolio at Risk is a practical early-warning tool. By tracking it regularly, investors can spot trouble before it becomes a major loss.
Try This Online Calculator: Portfolio Return Calculator
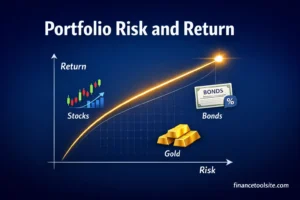
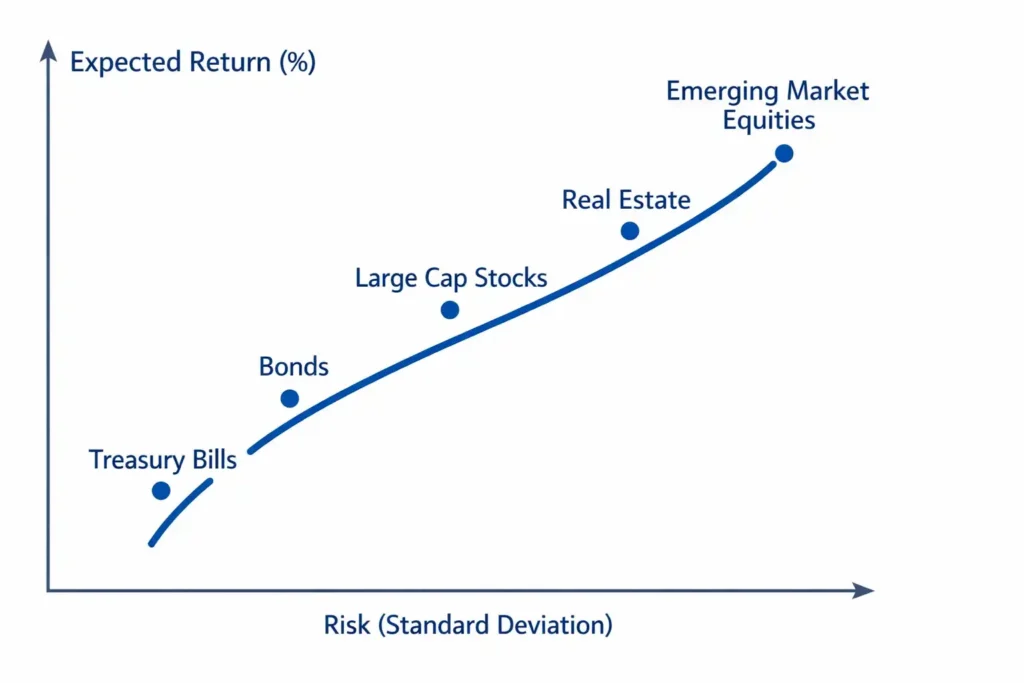
Understanding the Risk Return Relationship
The risk return relationship is the fundamental investing principle that higher potential returns come with higher levels of risk — and lower-risk investments generally offer lower expected returns. It is the core trade-off that every investor must navigate.
Think of it this way: would you lend money to a stranger with no credit history for the same interest rate you would charge a longtime friend with a perfect repayment record? Of course not. You would charge more to the stranger — because the risk is higher. Financial markets work the same way.
Real-Life Example
Consider two investors, Maria and James, each with $10,000 to invest over 10 years.
- Maria puts her money in a government bond fund earning roughly 3–4% annually. Her risk is very low, but so is her return.
- James invests in a diversified equity fund targeting 8–10% annual returns. His potential gain is higher, but so are the short-term swings in his portfolio value.
Neither choice is wrong — they simply reflect different points on the risk-return curve. Maria values stability. James is comfortable with volatility in exchange for long-term growth potential.
The Risk-Return Formula Concept
While no single equation captures the full relationship, the Capital Asset Pricing Model (CAPM) formalizes it:
Expected Return = Risk-Free Rate + Beta × (Market Return – Risk-Free Rate)
Here, Beta measures how sensitive an investment is to market movements. A Beta of 1.5 means the asset moves 50% more than the market — higher potential return, but also higher portfolio risk.
Risk Return Relationship in Financial Management
The risk return relationship in financial management goes far beyond individual investing. It is a central framework that companies, fund managers, and financial planners use to make capital allocation decisions, set investment policy, and build portfolios that serve defined objectives.
How Companies Use It
When a corporation decides whether to invest in a new factory, launch a new product line, or acquire a competitor, it performs a risk-return analysis. Expected profits are weighed against the probability of loss, cost of capital, and the impact on the company’s overall financial stability.
Chief Financial Officers (CFOs) use tools like Net Present Value (NPV) and Internal Rate of Return (IRR) — both rooted in the risk-return relationship — to evaluate which projects are worth pursuing.
How Fund Managers Use It
Portfolio managers at mutual funds, pension funds, and hedge funds use the risk return relationship in financial management to construct and rebalance portfolios. They target a specific risk-adjusted return — often measured using the Sharpe Ratio — which tells them how much return they earn per unit of risk taken.
A Sharpe Ratio above 1.0 is generally considered good; above 2.0 is excellent. It rewards portfolios that achieve strong returns without taking on unnecessary risk.
Modern Portfolio Theory (MPT)
Nobel Prize-winning economist Harry Markowitz formalized the risk return relationship in financial management through Modern Portfolio Theory (MPT). His key insight: combining assets that do not move together (low correlation) can reduce overall portfolio risk without sacrificing expected return.
This gave birth to the concept of the Efficient Frontier — a set of optimal portfolios that offer the maximum return for a given level of risk. Every rational investor should aim to be on or near this frontier.
Types of Portfolio Risk
Not all risk is the same. Understanding the different types of portfolio risk helps investors choose the right tools to manage each one effectively.
Systematic Risk
Systematic risk (also called market risk) affects the entire financial market and cannot be eliminated through diversification. Events like recessions, interest rate changes by central banks, or geopolitical crises fall into this category. Every investor faces systematic risk — the question is how much exposure they carry.
Unsystematic Risk
Unsystematic risk (also called specific or idiosyncratic risk) is unique to a particular company or sector. A product recall, a CEO scandal, or a factory fire can hurt one company while leaving the rest of the market unaffected. This type of portfolio risk CAN be reduced through diversification.
Market Risk
Market risk is the broad risk that asset prices will decline due to economic shifts, investor sentiment changes, or market-wide events. It overlaps with systematic risk and includes equity risk, currency risk, and commodity risk.
Interest Rate Risk
Interest rate risk is the danger that rising interest rates will reduce the value of fixed-income investments like bonds. When rates go up, existing bond prices fall — a critical consideration for any portfolio holding significant fixed-income assets.
Inflation Risk
Inflation risk (also called purchasing power risk) occurs when investment returns fail to keep pace with inflation. A portfolio earning 3% annually while inflation runs at 4% is actually losing real purchasing power — a hidden form of loss that many investors overlook.
Here is a comparison of all five risk types:
| Risk Type | Diversifiable? | Example | Impact on Portfolio Risk and Return | Strategy |
| Systematic Risk | No | Recession, Fed rate hike | Reduces overall market returns | Asset allocation, hedging |
| Unsystematic Risk | Yes | Company earnings miss | Impacts individual holdings | Diversification across sectors |
| Market Risk | Partially | Stock market crash | Broad portfolio value decline | Rebalancing, defensive assets |
| Interest Rate Risk | Partially | Bond price drop on rate hike | Hurts fixed-income holdings | Duration management, TIPS |
| Inflation Risk | No | CPI above portfolio return | Erodes real purchasing power | Equities, real assets, I-bonds |
How to Balance Portfolio Risk and Return (Practical Guide)
Knowing the theory is one thing. Applying it to real money is another. Here are two practical examples that show how different investors can balance portfolio risk and return effectively.
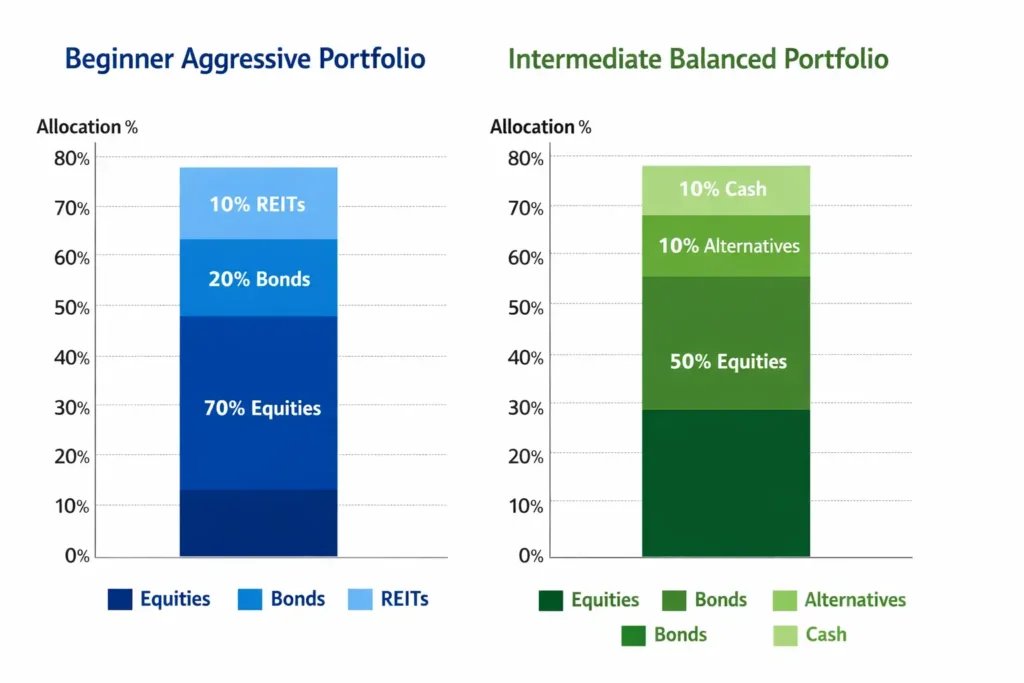
Beginner Example: The $5,000 Long-Term Investor
Sarah is 28 years old with $5,000 to invest for retirement, 35 years away. She can afford to ride out market downturns, so she takes a growth-oriented approach:
- 70% in a low-cost global equity index fund
- 20% in a diversified bond fund
- 10% in real estate investment trusts (REITs)
This allocation accepts higher short-term portfolio risk in exchange for stronger long-term growth potential. Sarah rebalances once per year to maintain her target ratios. Over 35 years, the compounding effect can turn her $5,000 into a substantial nest egg — even accounting for market corrections along the way.
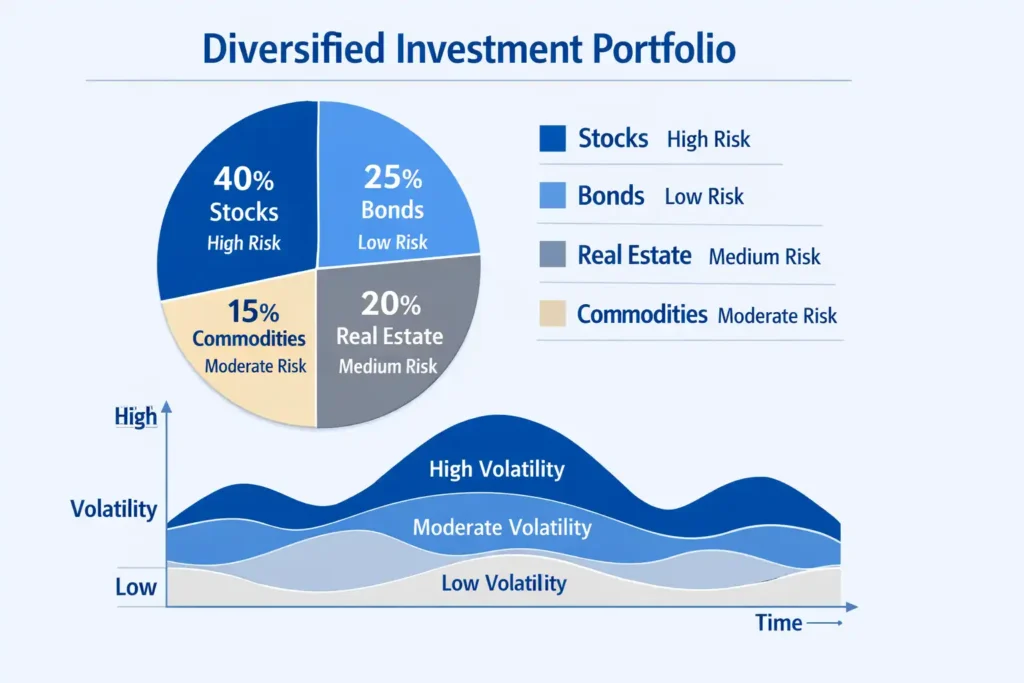
Intermediate Example: Active Allocation Strategy
David is 45 with a $120,000 portfolio. He wants moderate growth but cannot afford major losses — his kids start college in 8 years. He uses a more active strategy:
- 50% equities (mix of dividend stocks and growth ETFs)
- 30% bonds (short-to-medium duration to reduce interest rate risk)
- 10% alternatives (gold, commodities as inflation hedge)
- 10% cash equivalents (money market funds for liquidity)
David reviews his portfolio quarterly and shifts toward more conservative allocations as college approaches. This glide-path strategy is a proven method for reducing portfolio risk as financial goals get closer.
The key insight for both investors: there is no single “correct” balance. The right portfolio risk and return trade-off depends on your age, goals, income, time horizon, and emotional tolerance for watching your portfolio value fluctuate.
Portfolio Risk vs Individual Investment Risk
One of the most common misconceptions in investing is treating portfolio risk and individual investment risk as the same thing. They are not — and understanding the difference can dramatically change how you build your investment strategy.
Individual investment risk focuses on a single asset in isolation. A stock’s volatility, measured by its standard deviation, tells you how wildly its price tends to swing on its own. A stock with a 40% annual standard deviation is far more volatile than one at 10%.
Portfolio risk accounts for the combined behavior of all assets together. This is where correlation becomes the hero of the story.
If you hold two assets that always move in opposite directions (perfect negative correlation of -1), your portfolio risk can be reduced to nearly zero — even if each asset alone is highly volatile. Conversely, holding 10 stocks that all tend to rise and fall together offers very little risk reduction compared to holding just one.
This is the mathematical foundation behind diversification. By combining assets with low or negative correlations, you shrink portfolio risk without necessarily sacrificing return. This is the closest thing to a “free lunch” in finance — and it is the core logic behind Modern Portfolio Theory.
Common Mistakes in Managing Portfolio Risk
Even experienced investors fall into predictable traps when managing portfolio risk. Here are the most common mistakes — and how to avoid them:
- Overconcentration: Putting too much money into a single stock, sector, or country eliminates the benefits of diversification and exposes the portfolio to unnecessary unsystematic risk.
- Return chasing: Buying last year’s top performers is a classic behavioral mistake. By the time most investors notice strong returns, the easy gains have often already passed — and the risk of a reversal is at its peak.
- Ignoring correlation: Holding 20 technology stocks feels diversified, but if they all move together, the portfolio risk is barely lower than holding just one. True diversification requires assets with genuinely different drivers.
- Neglecting rebalancing: Over time, winning assets grow to dominate a portfolio, shifting risk beyond the investor’s intended level. Annual or semi-annual rebalancing restores the original risk profile.
- Letting emotions drive decisions: Panic-selling during downturns and greed-buying during rallies are the two most costly behavioral errors investors make. Both lock in losses or reduce future returns.
- Underestimating inflation risk: Holding too much cash or too many short-term bonds may feel safe, but inflation quietly erodes real purchasing power — a hidden form of portfolio risk many investors ignore.
- Misunderstanding time horizon: Investors with decades ahead often take too little risk (and sacrifice growth), while short-term investors sometimes take too much. Aligning risk with timeline is essential.
Frequently Asked Questions (FAQs)
What is portfolio risk?
Portfolio risk is the probability that a collection of investments will produce returns below expectations or result in financial loss. Unlike individual asset risk, portfolio risk accounts for how all holdings interact with each other through correlation. A well-diversified portfolio can significantly reduce unsystematic risk while still participating in market growth. It is measured using tools like standard deviation, beta, and Value at Risk (VaR).
What is portfolio at risk?
Portfolio at risk (PAR) measures what percentage of a portfolio is exposed to potential impairment or loss beyond a defined threshold. It is calculated by dividing the value of at-risk assets by total portfolio value and multiplying by 100. For example, $30,000 at risk in a $200,000 portfolio produces a PAR of 15%. This metric is widely used in microfinance and institutional portfolio management as an early warning signal.
What is the risk return relationship?
The risk return relationship is the core investing principle that higher potential returns are associated with higher levels of risk. Safer investments like government bonds offer predictable but modest gains, while riskier assets like equities or emerging market funds offer higher potential returns — along with greater volatility. This trade-off guides virtually every investment decision, from individual stock picks to large institutional asset allocation strategies.
What is risk return relationship in financial management?
The risk return relationship in financial management is the principle that guides how companies and fund managers allocate capital. Businesses use it to evaluate projects via NPV and IRR analysis. Portfolio managers use it to build efficient portfolios that maximize return per unit of risk. It underpins Modern Portfolio Theory, the Efficient Frontier, and the Capital Asset Pricing Model — all foundational frameworks in corporate finance and investment strategy.
How does diversification reduce portfolio risk?
Diversification reduces portfolio risk by combining assets that do not move in perfect synchrony. When one asset falls in value, others may hold steady or rise, cushioning the overall impact. The mathematical key is correlation — the lower the correlation between assets, the greater the risk-reduction benefit. A well-diversified portfolio can eliminate most unsystematic (company-specific) risk while still being exposed to unavoidable systematic (market-wide) risk.
Is higher return always linked to higher portfolio risk?
Generally yes, but not always proportionally. The risk return relationship suggests that higher rewards require accepting more uncertainty — but smart diversification and active management can improve the risk-adjusted return (Sharpe Ratio) without simply adding more risk. Some assets offer attractive returns relative to their risk level at certain market cycles. That said, any promise of high guaranteed returns with low risk is a major red flag for potential fraud.
Conclusion
Portfolio risk and return are two sides of the same coin. You cannot chase one without understanding the other. By learning what portfolio risk truly means — beyond the surface level — and by applying the risk return relationship to your own financial decisions, you position yourself to make smarter, more confident choices with your money.
Whether you are a first-time investor building a $5,000 retirement account or a seasoned professional managing a complex institutional fund, the principles in this guide apply. Understand your risk types, measure your Portfolio at Risk regularly, diversify thoughtfully, and never let short-term emotions override your long-term strategy.
The goal is not a portfolio with zero risk. The goal is a portfolio whose risk is known, understood, and deliberately matched to your goals.
Disclaimer: This article is for educational purposes only and does not constitute financial advice. Always consult a qualified financial advisor before making investment decisions. Past performance is not indicative of future results.