
Most salaried people don’t have a clear idea where their money disappears every month. That’s exactly where this 50 30 20 rule spreadsheet helps.
No complicated apps. No confusing finance jargon. Just one simple sheet that splits your salary into three buckets — Needs, Wants, and Savings — and automatically shows where your money is going.
I’ve worked with hundreds of salaried professionals across India, and almost all of them struggled with the same thing — not low income, but lack of a clear system. That’s why budgeting usually fails.
This 50-30-20 rule spreadsheet fixes that by simplifying everything into three numbers you can actually follow — especially if you’re trying to save money from your salary or even save money fast on a low income without overcomplicating things.
Table of Contents
What Is the Download Free 50 30 20 Rule Spreadsheet ?
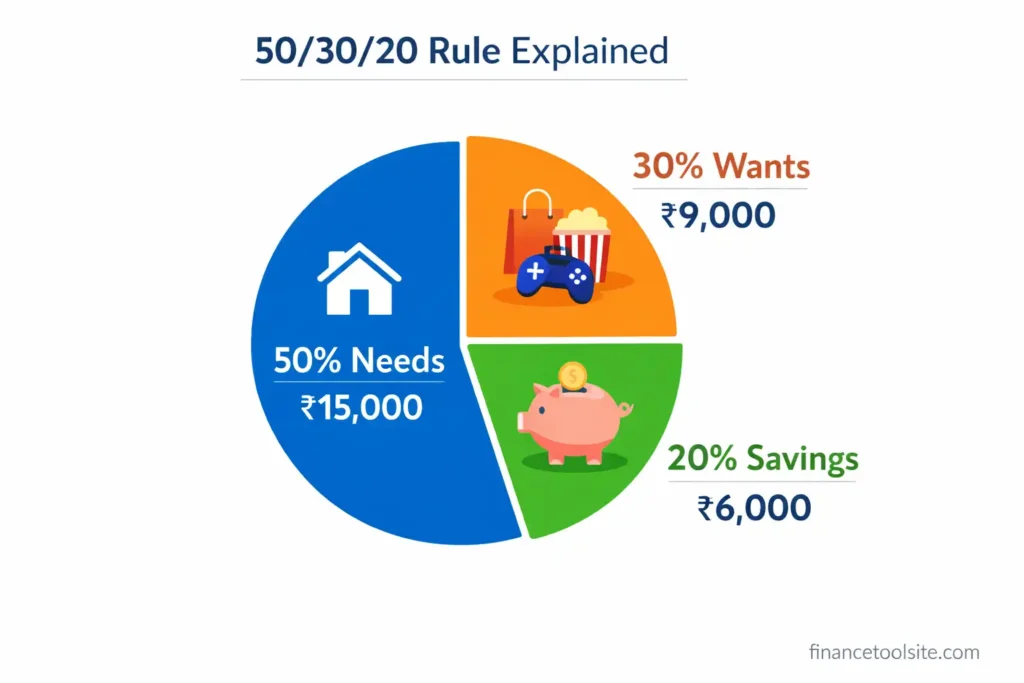
The 50/30/20 rule is a personal budgeting method that splits your monthly take-home income into three categories. That’s it. No 12 different expense heads to track. No weekly reviews. Just three numbers.
Here’s how it works for a ₹30,000 monthly salary:
| Category | % Split | Recommended Amount | What Goes Here |
| 🏠 Needs | 50% | ₹15,000 | Rent, groceries, bills, transport, EMIs |
| 🎉 Wants | 30% | ₹9,000 | Dining out, OTT, shopping, travel |
| 💰 Savings | 20% | ₹6,000 | SIP, emergency fund, FD, PPF |
| TOTAL | 100% | ₹30,000 | Your full monthly salary |
On ₹30,000 income: ₹15,000 goes to everything you need (rent, groceries, electricity, commute, loan EMIs). ₹9,000 goes to things you want (eating out, Netflix, weekend plans, new clothes). And ₹6,000 goes straight to your future (SIP, emergency fund, FD, PPF).
| The Rule in One Line: 50% survive, 30% enjoy, 20% grow. Master these three numbers, and you’ll never feel broke again — even on a modest salary. |
The beauty of this rule is that it works at any income level. Whether you earn ₹20,000 or ₹2,00,000, the percentages stay the same. Only the rupee amounts change.
The 50 30 20 rule spreadsheet I’ve built for you is available for free download above. It works on Excel, Google Sheets, and any modern spreadsheet app. You don’t need to create anything from scratch — just download, enter your income, and you’re done.
What’s Inside the Spreadsheet
- Section 1 — Income Input: One cell to enter your monthly salary. Everything else calculates automatically.
- Section 2 — Budget Breakdown Table: Automatically shows your Recommended Amount for Needs, Wants, and Savings, plus a column for your Actual Spending and the Difference.
- Section 3 — Summary Dashboard: Total income, total spending, remaining balance, and budget utilisation — all auto-filled.
- Pie Chart: A live visual of your budget split that updates the moment you change your income.
- Conditional Formatting: Difference column turns Red when you overspend and Green when you’re under budget.
- Smart Status Message: Tells you in plain English whether you’re within budget or not.
| How to Use in Google Sheets: Download the .xlsx file → Go to Google Drive → Click New → Upload the file → Right-click and select ‘Open with Google Sheets’. All formulas and formatting transfer perfectly. |
How to Use This 50 30 20 Rule Spreadsheet (Step-by-Step)
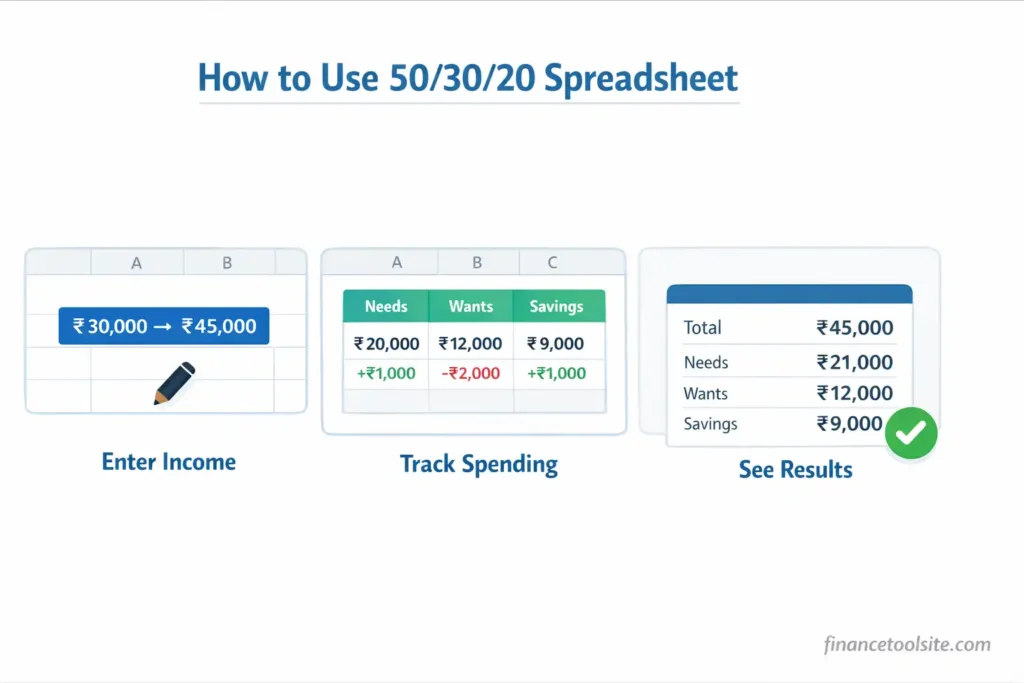
The sheet is designed so that even if you’ve never used a spreadsheet before, you’ll be up and running in under two minutes. There are only four cells you ever need to touch.
Step 1 — Open the Sheet and Find Section 1 (Income Input)
Look for the cell with a blue border — that’s your income cell (cell D6). It’s pre-filled with ₹30,000 as an example. Simply replace it with your actual monthly take-home salary.
Example: You earn ₹45,000 per month. Type 45000 in that cell. The entire sheet recalculates instantly — Needs becomes ₹22,500, Wants becomes ₹13,500, Savings becomes ₹9,000.
Step 2 — Review Section 2 (Budget Breakdown Table)
The Budget Breakdown Table has five columns:
- Category: Needs, Wants, Savings
- Recommended %: 50%, 30%, 20% — locked
- Recommended Amount (₹): Auto-calculated from your income
- Actual Spending (₹): ← This is where YOU type your monthly expenses
- Difference (₹): Auto-calculated. Positive = under budget. Negative = overspent.
For ₹30,000 income: If you actually spent ₹14,000 on Needs, type 14000 in the Needs row. The Difference column will immediately show +₹1,000 in green — meaning you saved ₹1,000 extra in that category.
Step 3 — Check Section 3 (Summary)
Section 3 shows you the big picture:
- Total Monthly Income: Your entered salary
- Total Recommended Budget: Should equal your income (100%)
- Total Actual Spending: Sum of what you actually spent
- Remaining Balance: Income minus total spending
- Budget Utilisation %: What % of income you’ve used
- Status Message: “✅ Great job! You are within budget” or “⚠️ Warning: You have exceeded your budget!”
| Monthly Reset: At the start of every new month, just update the three Actual Spending cells (E13, E14, E15). Takes less than 60 seconds. |
Real Example: ₹30,000 Salary Breakdown Using the Spreadsheet
Let me walk you through exactly how the sheet works with a real Indian salary scenario.
Meet Priya. She’s a junior software engineer in Pune earning ₹30,000 take-home per month. Before using this spreadsheet, she had no idea where her money went. She’d check her account on the 25th and wonder why it was nearly empty.
What the Sheet Calculates for Priya
| Category | Rule % | Rec. Amount | Priya Spent | Difference |
| 🏠 Needs | 50% | ₹15,000 | ₹14,000 | +₹1,000 ✅ |
| 🎉 Wants | 30% | ₹9,000 | ₹10,500 | -₹1,500 ⚠️ |
| 💰 Savings | 20% | ₹6,000 | ₹6,000 | ₹0 ✅ |
The spreadsheet instantly shows Priya that she overspent on Wants by ₹1,500 (the Difference column turns red). She was fine on Needs (saved ₹1,000) and hit her savings target exactly. Without this sheet, she’d have no idea which category ate her money.
That ₹6,000 savings? Over 12 months, that’s ₹72,000. Invested in a SIP (use our sip calculator india to see how that grows), it could become significantly more over 5–10 years.
Benefits of Using a 50 30 20 Rule Spreadsheet
Most people know they should save money. Very few actually do it consistently. Using a 50 30 20 rule spreadsheet removes the friction between knowing and doing.
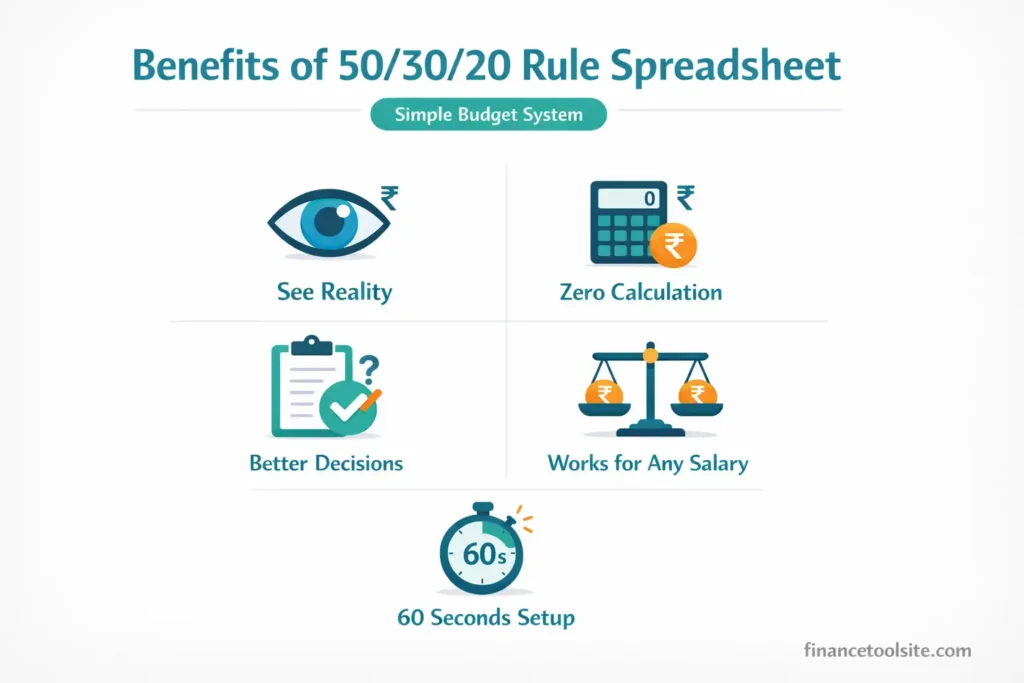
- You See Reality Instantly
Before the sheet: “I think I’m spending around ₹12,000 on needs.” After the sheet: “I spent ₹16,800 on needs — that’s ₹1,800 over my limit.” Numbers don’t lie. The sheet shows you exactly where you stand, every single month.
- Zero Calculation Work
This sheet automatically calculates everything the moment you enter your income. No mental math. No calculator. No errors. Change your salary from ₹30,000 to ₹35,000 and every figure in the sheet updates in under a second.
- It Guides Better Decisions
When Wants turns red, it’s a clear signal — not a judgment. You’ll naturally start asking: “Do I really need a third streaming subscription?” The visual feedback drives better choices without anyone nagging you.
- Works for Every Salary Level
Whether you earn ₹18,000 as a fresher or ₹1,50,000 as a senior professional, the percentages work the same. Once you know how much you can actually afford, you can plan bigger financial decisions more confidently — for example, checking your budget before buying a home using a home affordability calculator.
- Takes 60 Seconds Per Month
Four cells. That’s all you update each month. Income once. Three spending actuals. Sixty seconds of effort for complete visibility into your finances.
Simple budgeting methods like this are widely recommended because they create a balance between spending and saving. You can also explore government-backed saving schemes and financial planning options to understand how structured saving helps in the long term.
Common Mistakes People Make with the 50/30/20 Rule
I’ve seen smart people stumble on the same things repeatedly. Avoid these:
Mistake 1: Mixing Up Needs and Wants
Eating at home = Need. Ordering Swiggy every night = Want. Groceries are a need. Zomato Gold membership is a want. Basic internet is a need. Upgrading to a premium plan for speed you don’t really use is a want. When in doubt, ask: “Could I survive without this this month?”
Mistake 2: Forgetting Annual Expenses
Insurance premiums, annual subscriptions, festival shopping — these hit once a year but feel catastrophic when they do. Divide them by 12 and add that amount to your Needs or Wants column every month. This keeps your budget realistic year-round.
Mistake 3: Treating Savings as ‘Leftover Money’
The 50/30/20 rule treats savings as non-negotiable. Don’t save what’s left after spending. Spend what’s left after saving. When you enter ₹6,000 in the Savings row, treat it as already gone — transferred to your SIP or FD on salary day.
Mistake 4: Abandoning the System After One Bad Month
One month where you overspend doesn’t mean the system failed. It means you have data. The sheet shows you exactly where you went over. Use that information to adjust next month. Consistency over perfection, always.
Mistake 5: Using Gross Salary Instead of Take-Home Pay
Always enter your take-home salary (after PF, TDS, and other deductions) in the Income cell. Using your CTC or gross salary gives you an inflated budget that doesn’t match reality.
Frequently Asked Questions
Q: What if my rent alone exceeds 50% of my salary?
This is common in expensive cities like Mumbai or Bangalore. If rent is ₹18,000 on a ₹30,000 salary, you’re already at 60% on just one item. In that case, compress Wants to 20% and maintain a minimum 10% savings. The rule is a framework, not a jail. Adjust the percentages, but never eliminate savings entirely.
Q: Should I count EMIs as Needs or Savings?
Home loan EMIs go under Needs — it’s a committed monthly obligation. However, the asset you’re building (your home) is also growing your net worth, so mentally it’s a hybrid. Personal loan EMIs are purely Needs. Never count EMIs as Savings — savings is only money that goes into wealth-building instruments like SIP, FD, PPF, or emergency fund.
Q: Can I use this 50 30 20 rule spreadsheet for a household budget with two incomes?
Absolutely. Just enter your combined take-home income in cell D6. The recommended amounts will calculate for the total household budget. You can then track actual spending as a household unit. Many couples find this brings financial transparency and reduces money conflicts.
Q: How often should I update the spreadsheet?
Once a month is enough. On the 1st of each new month, enter last month’s actual spending in the three blue-border cells (E13, E14, E15). It takes less than a minute and gives you a full picture of how last month went before you start fresh.
Q: Does the 50/30/20 rule work if I have irregular income?
Yes, but use your lowest expected monthly income as your baseline. If your income ranges between ₹25,000 and ₹40,000, budget as if you earn ₹25,000. In higher-income months, the extra becomes a bonus that goes straight to savings or an emergency fund.
Q: Where does emergency fund go in this spreadsheet?
Emergency fund contributions go in the Savings row (20% bucket). Aim to build 3–6 months of expenses as your emergency fund first, before investing in SIP or other instruments. Once your emergency fund is complete, redirect that portion to investments.